The moment Pipeline connects to Mindbody or Xplor Mariana Tek, your leads, memberships, attendance, and revenue data start flowing in automatically—no manual exports, no CSV uploads.
2. Every metric lands on one dashboard
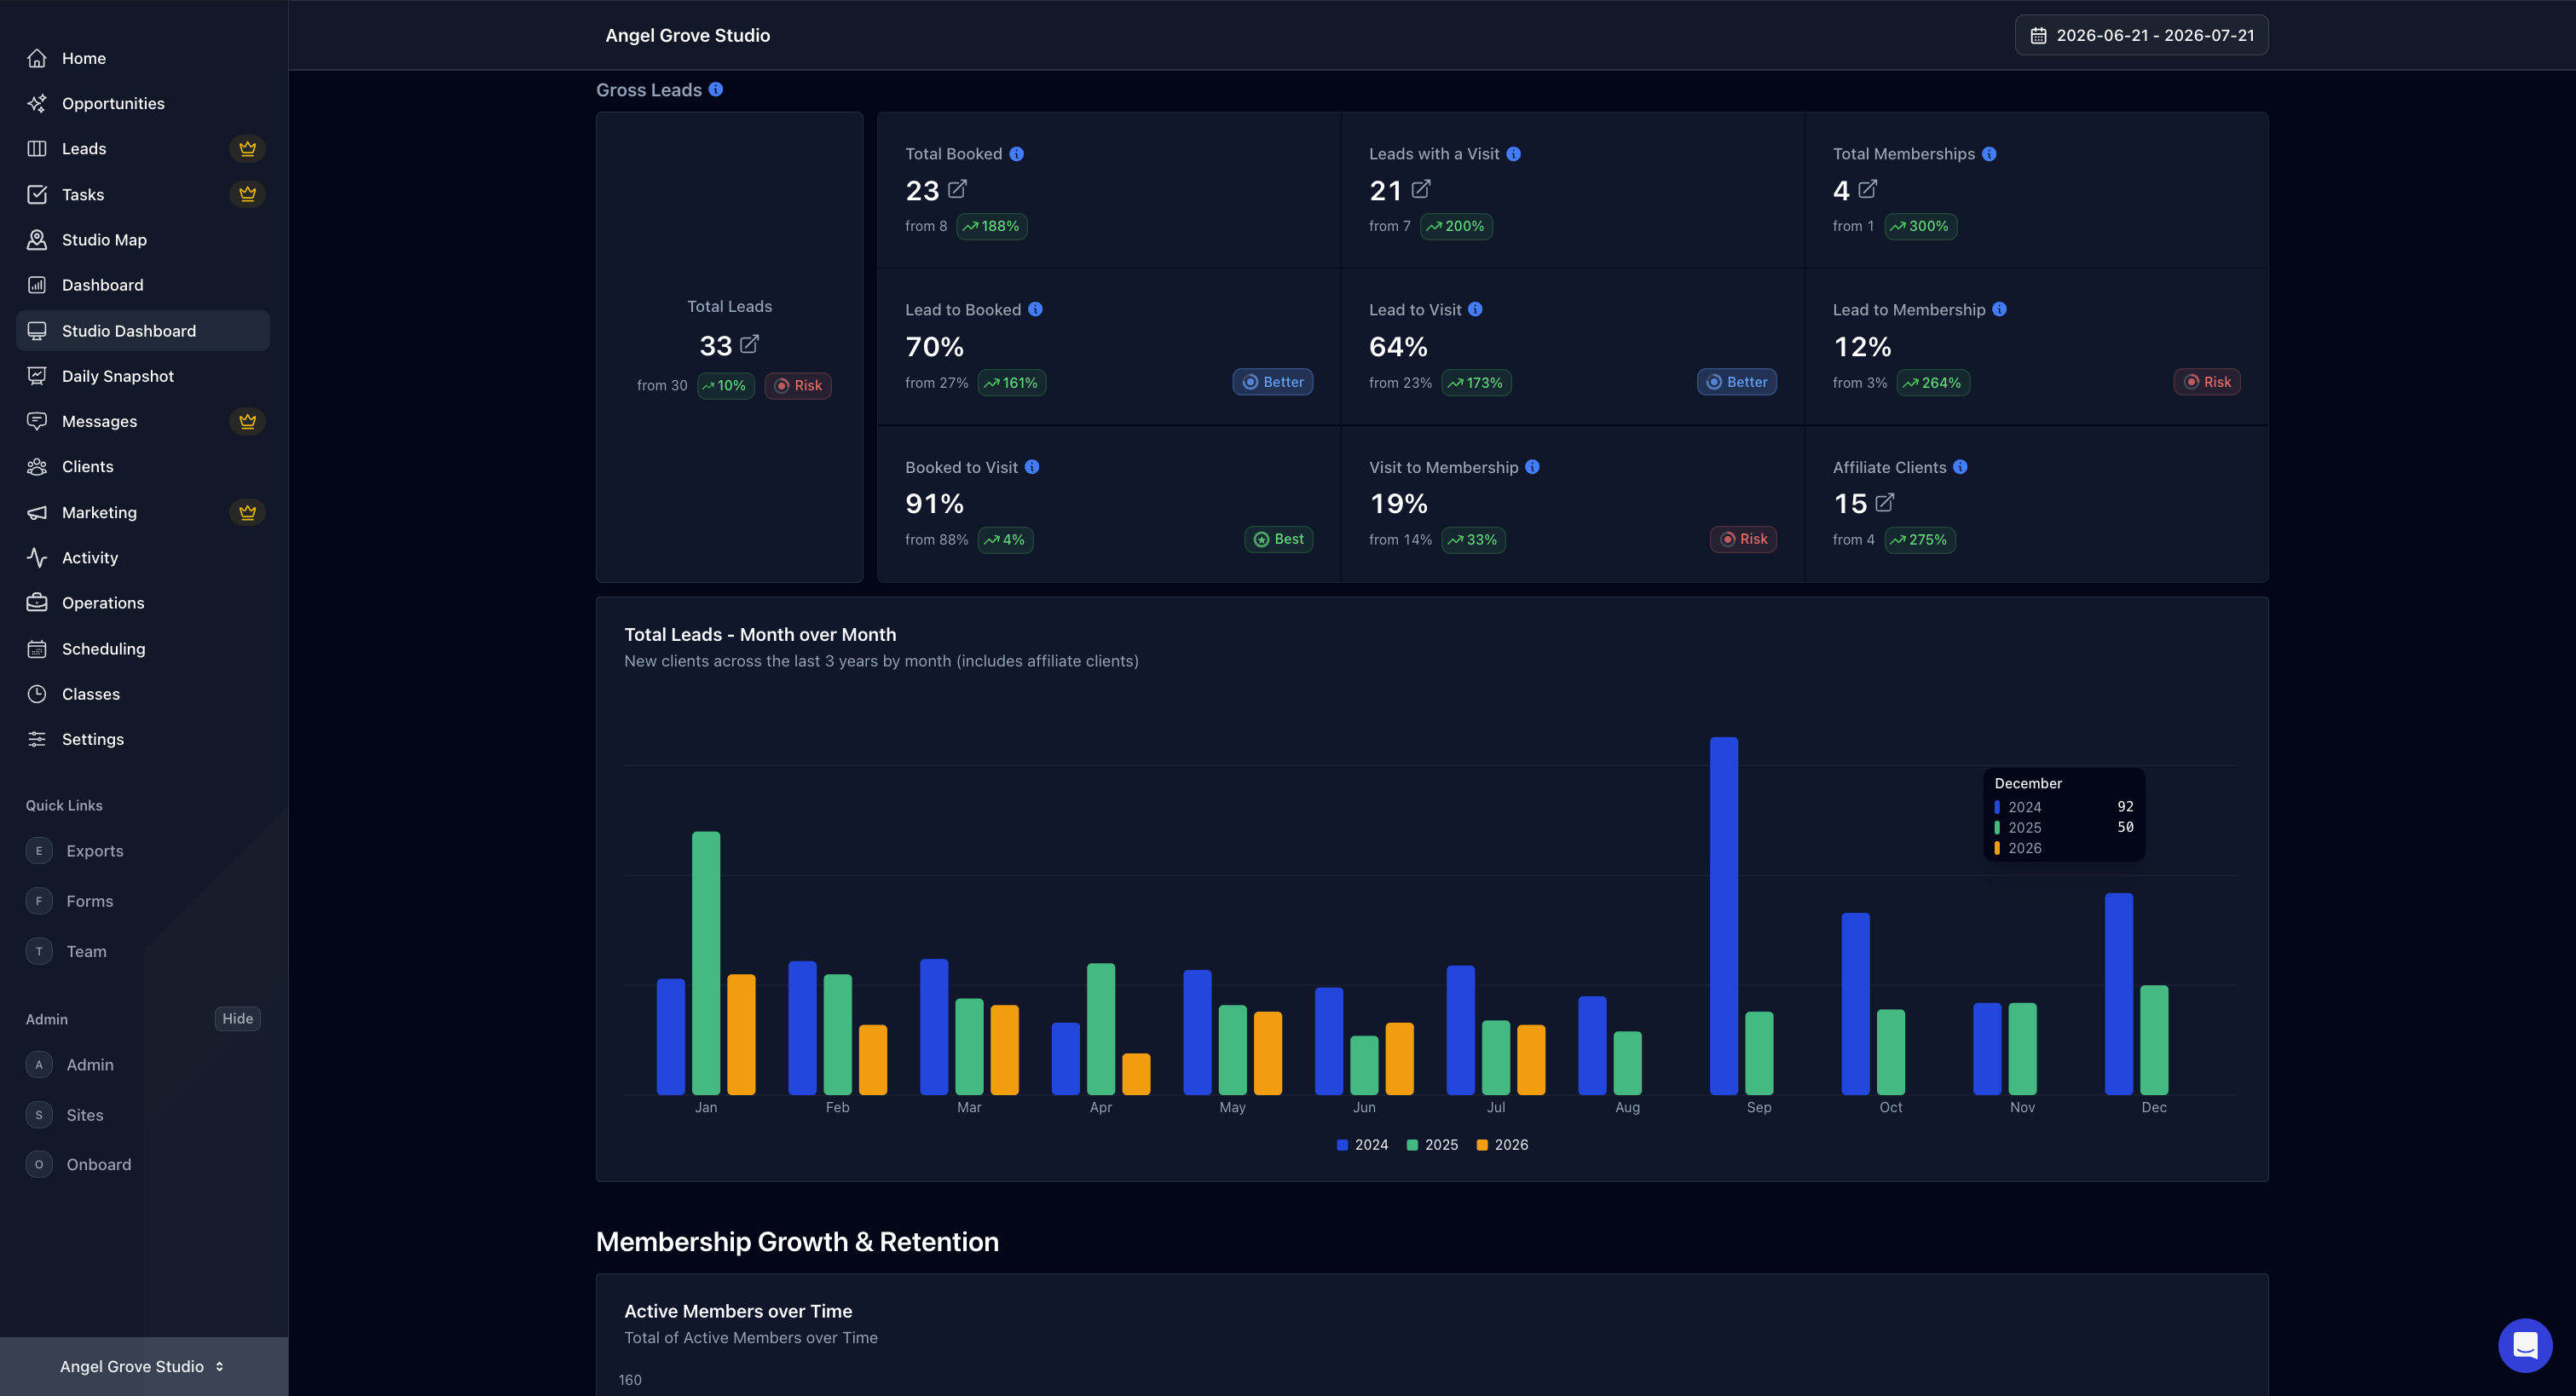
Leads, membership growth, retention, revenue performance, and attendance are organized into one view, so you're never bouncing between five different reports to get the full picture.
3. Your dashboard stays current, automatically
You're always working with current numbers, not something you exported last month.
4. Filter to any date range you need
Compare this month to last, check a specific week, or look at trends over a quarter—dynamic date filtering lets you slice the data however you need it, instantly.
5. You see what to focus on, not just what happened
Instead of a wall of numbers, Pipeline surfaces what actually matters—where conversions are slipping, which revenue streams are growing, and where your attention is needed most.
Leads
See every new lead and where they came from, along with how well they're converting. You'll know if your pipeline is actually growing or just staying busy.
Membership Growth
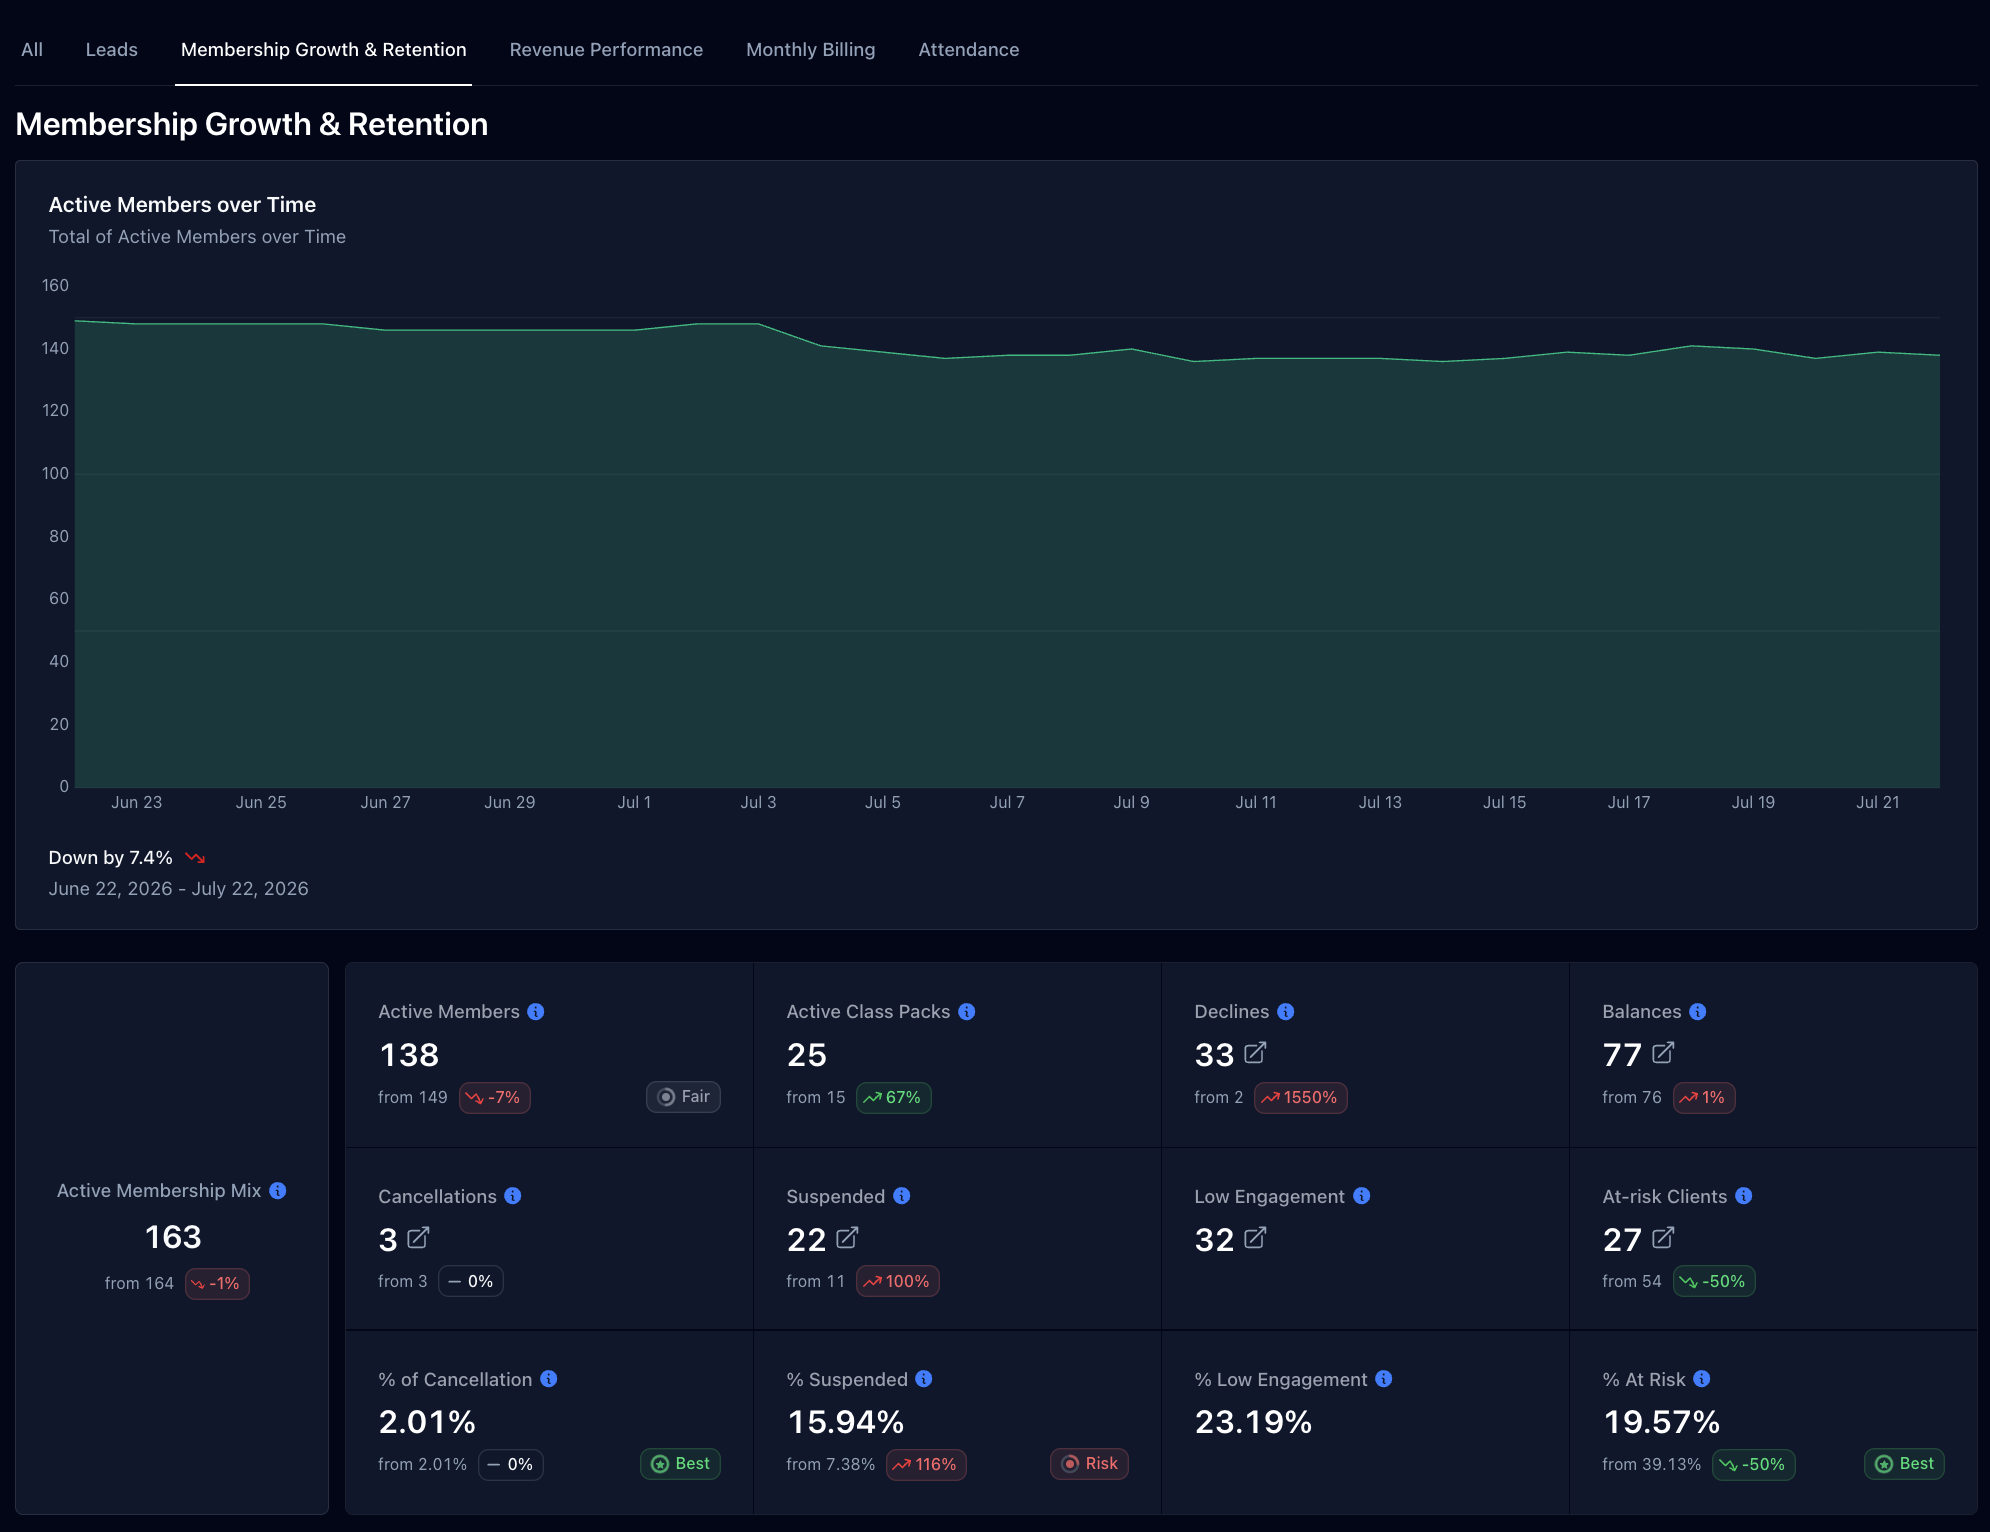
Track new members, cancellations, and net growth over time. It's the difference between a month that looked good and a month that actually was.
Revenue performance
Know exactly where your money comes from, not just what the total adds up to.
Retention
Spot churn and at-risk members before they cancel. Retention becomes something you actively manage, rather than something you notice too late.
Attendance
See which classes are full, which are empty, and how attendance shifts over time. Make scheduling decisions based on real patterns, not gut feel.
Dynamic date filtering
Compare this week to last, or this month to last quarter. Spotting a trend becomes easy instead of relying on how one particular day went.
Text & call volume
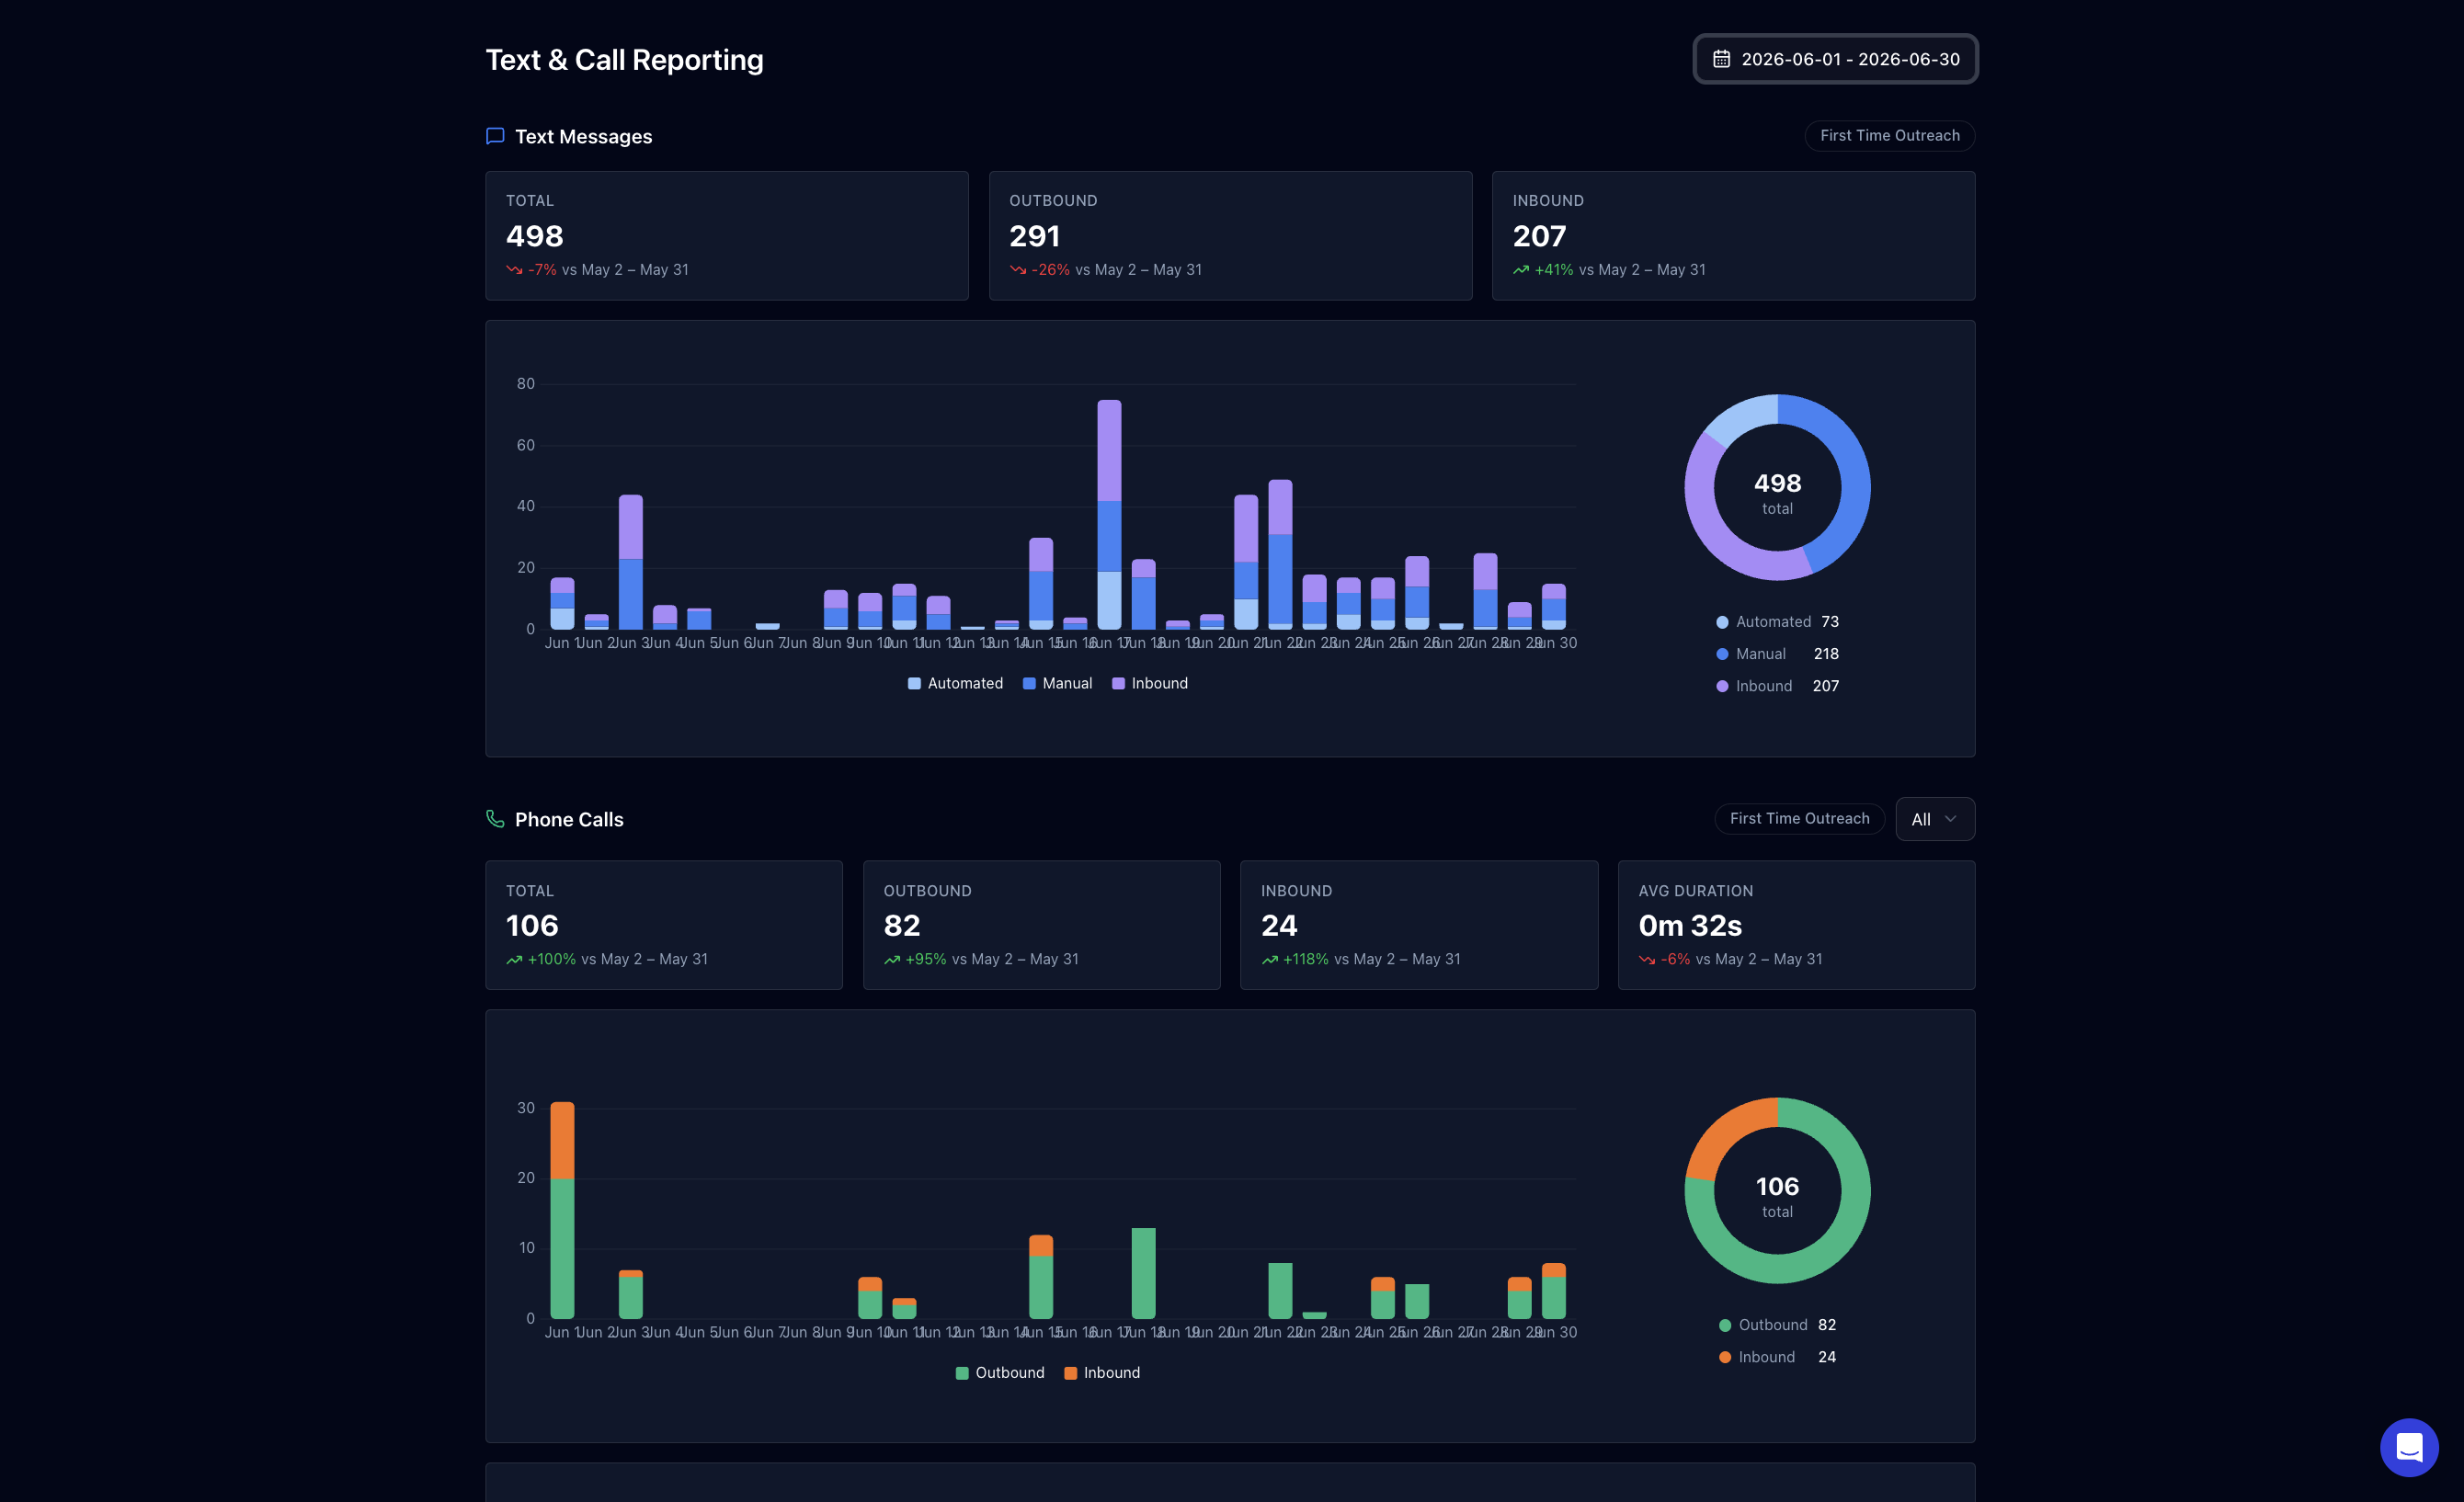
See exactly how many texts and calls went out, and how many came in—split between automated and manual outreach—so you know if your team's follow-up is keeping pace with your lead volume.
Trends over time
Compare outbound and inbound activity month over month, so you can tell if a slow week was about fewer leads or less follow-up.
Response patterns
Track call duration and inbound response rates to see whether outreach is actually landing—not just happening.
Integrations
Works with the tools you already use
Pipeline connects directly to your booking platform, accounting software, and communication tools—so everything flows automatically, with no manual entry.
Pipeline replaces the spreadsheets and guesswork with data you can actually trust—less time managing disconnected systems, more time growing your studio.